Friday, April 23, 2010

Univariate Choropleth Map


Univariate Choropleth Map is a chloropleth map where only one set of data is displayed.

This map shows poverty levels in the US.

Bivariate Chloropleth map


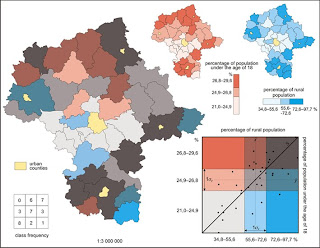
A bivariate chloropleth map displays two variables on a single map by combining two different sets of graphic symbols or colors.Two-variable choropleth maps can be used as a useful tool for visualization of geographical relationship. The map above depicts the percentage of population under the age of 18, and also the percentage of the general population.

Unclassed Chloropleth Map


This technique assigns shadings proportional to the data values so that these choropleth maps do not have to classify the data. The map here is of fertility rates in Africa.

Classed chloropleth Map


A Classed Chloropleth Map uses smaller variables than a general chloropleth map to portray data, which is broken down into scale. This map depicts the population densityof New England.

Nominal Area Chloropleth Map


This type of map is simply a chloropleth map that shows nominal data.

Bilateral Graph


A bi-lateral graph is a visualization map. Two related variables are identified as well as their overlaps.

Lorenz Curve Map


The Lorenz Curve is a graphical representation of the proportionality of a distribution. It represents a probability distribution of statistical values, and is often associated with income distribution calculations and commonly used in the analysis of inequality.
http://www.unc.edu/depts/econ/byrns_web/Art/Glossary/LorenzCurve.jpg

DOQQ


A digital orthophoto quadrangle (DOQ)
is a computer-generated image of an
aerial photograph in which image
displacement caused by terrain relief and camera tilt.

Triangular Plot Map


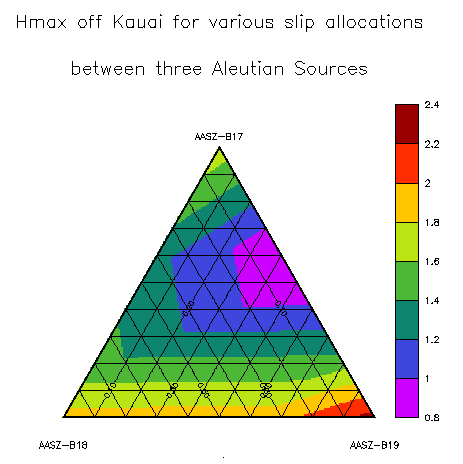
A triangular plot map is used to plot three different variables which sum to a constant.

Parrallel Coordinate Map


Used with high demensional data sets, in a parallel coordinate view, the parallel coordinate map is a common information visualization technique.


http://hcil.cs.umd.edu/trs/2001-22/2001-22_files/image035.gif

DEM Map


A DEM, or digital elevation model represents ground topography or terrain.

DLG Map


A digital line grapg, or DLG is a digital vector that represents cartographic infromation.

DRG map


A digital raster graphic (DRG) is a scanned image of a U.S. Geological Survey (USGS) standard series topographic map, including all map collar information.


Isopleth Map


A map that shows contour lines that join points of equal value.

Isopach Map


An isopach map is a map illustrating variation of thickness within a stratum in the atmospere. The lines on an isopach map are contour lines of equal thikness over an area.


Isohyets


Isohyet Maps show areas that have the same amount of rainfall. The lines on the map connect ares with the same amount.

Isotachs


An Isotachs Map shows where areas and what the wind speed isin that area. The Isopachs are lines on a given surface that connect areas withsame wind speed.

Isobars


An Isobar Map show lines of equal atmospheric pressure. Each line passes through a pressure wih a given value.

LIDAR


LIDAR, or light detection and ranging, uses optical remote sensing technology that measure properties of scattered light to find range and/ or other information of a distant target. It is a remote sensing technique similar to radar.