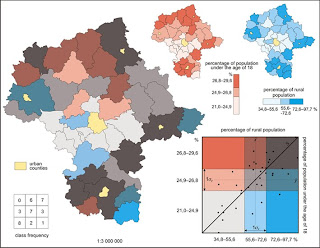
A bivariate chloropleth map displays two variables on a single map by combining two different sets of graphic symbols or colors.Two-variable choropleth maps can be used as a useful tool for visualization of geographical relationship. The map above depicts the percentage of population under the age of 18, and also the percentage of the general population.


