Friday, April 23, 2010

Univariate Choropleth Map


Univariate Choropleth Map is a chloropleth map where only one set of data is displayed.

This map shows poverty levels in the US.
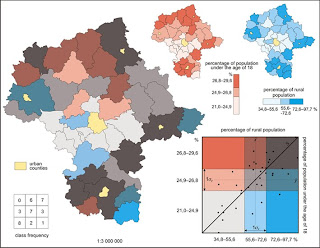
Bivariate Chloropleth map


A bivariate chloropleth map displays two variables on a single map by combining two different sets of graphic symbols or colors.Two-variable choropleth maps can be used as a useful tool for visualization of geographical relationship. The map above depicts the percentage of population under the age of 18, and also the percentage of the general population.

Unclassed Chloropleth Map


This technique assigns shadings proportional to the data values so that these choropleth maps do not have to classify the data. The map here is of fertility rates in Africa.

Classed chloropleth Map


A Classed Chloropleth Map uses smaller variables than a general chloropleth map to portray data, which is broken down into scale. This map depicts the population densityof New England.

Nominal Area Chloropleth Map


This type of map is simply a chloropleth map that shows nominal data.

Bilateral Graph


A bi-lateral graph is a visualization map. Two related variables are identified as well as their overlaps.

Lorenz Curve Map


The Lorenz Curve is a graphical representation of the proportionality of a distribution. It represents a probability distribution of statistical values, and is often associated with income distribution calculations and commonly used in the analysis of inequality.
http://www.unc.edu/depts/econ/byrns_web/Art/Glossary/LorenzCurve.jpg

DOQQ


A digital orthophoto quadrangle (DOQ)
is a computer-generated image of an
aerial photograph in which image
displacement caused by terrain relief and camera tilt.

Triangular Plot Map


A triangular plot map is used to plot three different variables which sum to a constant.

Parrallel Coordinate Map


Used with high demensional data sets, in a parallel coordinate view, the parallel coordinate map is a common information visualization technique.


http://hcil.cs.umd.edu/trs/2001-22/2001-22_files/image035.gif

DEM Map


A DEM, or digital elevation model represents ground topography or terrain.

DLG Map


A digital line grapg, or DLG is a digital vector that represents cartographic infromation.

DRG map


A digital raster graphic (DRG) is a scanned image of a U.S. Geological Survey (USGS) standard series topographic map, including all map collar information.


Isopleth Map


A map that shows contour lines that join points of equal value.

Isopach Map


An isopach map is a map illustrating variation of thickness within a stratum in the atmospere. The lines on an isopach map are contour lines of equal thikness over an area.


Isohyets


Isohyet Maps show areas that have the same amount of rainfall. The lines on the map connect ares with the same amount.

Isotachs


An Isotachs Map shows where areas and what the wind speed isin that area. The Isopachs are lines on a given surface that connect areas withsame wind speed.

Isobars


An Isobar Map show lines of equal atmospheric pressure. Each line passes through a pressure wih a given value.

LIDAR


LIDAR, or light detection and ranging, uses optical remote sensing technology that measure properties of scattered light to find range and/ or other information of a distant target. It is a remote sensing technique similar to radar.


Windrose map


A windrose map is a diagrm that is used to summerize information about the wind at a particular location over a specified time period.

Population Profile


Population profile maps create a graphic which depicts a population and what it is comprised of.This is a population profile map of Texas


Index Value Plot


The index value plot, shows a stationary variable and a variant that fluctuates accordingly.

Climograph


Monthly precipitation and temperature conditions for a selected place can be compiled and revealed in a Climograph. The bar graph potion of the graph represents the precipitation, while the line graph represents the temperature. Having these two data sets in one image makes it simple and easy to correlate the two bits of information.

http://www2.volstate.edu/kbell/BrazilClim.jpg

Scatter Plot


A Scatter Plot is a type of mathematical diagram that uses Cartesian coordinates to denote values for two variables for a set of data.

http://www2.warwick.ac.uk/fac/sci/moac/degrees/modules/ch923/r_introduction/scatter_plots/scatter2.png

Dopplar Radar


Dopplar Radar Maps show velocity data and objects at a distance by using Doppler radar. Microwaves are projected out into the atmosphere (or at any object) and then the reflected waves are analyzed. Meteorologists use Dopplar to create these Doppler maps that we can see everyday on the weather channels.

Histogram

http://www.cyber-wit.com/images/gallery/histogram1_b.png


A histogram represents information in tabular frequencies. In this example there are adjacent rectangles, which represent frequencies over an interval.

Box Plot


Box Plots are nicknamed "whisker plots" and graphically depicts numerical data through five number summaries. Box Plots are non-parametric and can be used to display differences in populations without making underlying assumptions about the underlying statistical distribution.


http://www.lohninger.com/comimg/boxplot.gif

Stem and Leaf Plot


The stem and leaf plot presents quantitative data in a graphical format.

http://www.mrexcel.com/chal070106.jpg

Similarity Matrix


A Similarity Matrix is a matrix of scores which express the similarity between two data points.

http://cgi.mtc.sri.com/Cluster-Lab/01.jpg

Correlation Matrix


This type of map shows correlations between all pairs of data sets. The Matrices above are of climate data sets.


http://www.image.ucar.edu/GSP/Projects/JunIPCCModelBiasCorrelations.jpg

Infrared Aerial Photo

Infrared Aerial Photos can show differences in land coverings. The one above is of Delta National Park. It can be used as a tool, to show changes in the environment, damaged structures, the health of the environment, and muchmore.
http://www.deltanationalpark.org/images/images/discovery-bay-aerial-web.jpg

Cartographic Animations

http://maps.unomaha.edu/AnimArt/ActiveLegend/JavaScript/java.html

The link above directs you to an example of a cartographic Animated map. Which is a map that entails some sort of movement.

Thursday, April 22, 2010

Statistical Map

Statistical maps represent any given statistic value relative to the area, spatially on the map. It allows the reader to have a "big picture" take on the values represented.


http://www.bls.gov/lau/maps/twmcort.gif

Cartograms


A Cartogram represents statistical data geographically on a map. What would normally represent land area on a map is replaced with some sort of thematic mapping variable. This is a representation of each state in the US and what political party the majority of the population in that state claims.


http://www-personal.umich.edu/~mejn/election/2008/

Flow Maps

A flowmap can be used to show movement of just about anything, both tangible or intangible
To the right is a flow map representing the flow of exported French wine in the year 1864.


http://en.wikipedia.org/wiki/File:Minard%E2%80%99s_map_of_French_wine_exports_for_1864.jpg

Proportional Circle Map

A proportional circle map uses circles that are portioned out to represent a quantity. It is a visual aid that organizes information so it is fast and easy to portray the idea to the reader. This circle map reveals how each industry in Germany is proportioned out.


http://www.lib.utexas.edu/maps/europe/west_germany_ind_1972.jpg

Isoline Maps


s.

An isoline map is a map that utilizes continuous lines which are joined at points of the same value. This maps represents air temperatures world wide.


http://geography.uoregon.edu/envchange/clim_animations/gifs/tmp2m_web.gif

Chloropleth Map


A Chloropleth Map uses shading or color to represent values in each area sectioned in the map. As you can see in the example above, divorce rates are represented and their distribution.

http://www.pop.psu.edu/images/gia/maps/changeanim.gif

Dot Distribution Map


A dot distribution map is used to represent populaton distributions. A given number of population is represented by a dot. In this map, the Iranian blogsphere is represented. The size of each dot represents the number in each population, and the position of each dot is a function of its links with its neighbors.


http://mountainrunner.us/images/MappingtheIranianBlogosphere_9976/image.png

Wednesday, April 21, 2010

Propagada Map


Maps in which political information is embedded to sway the reader is an example of a propaganda map. These maps can be used to intimidate, or empower the reader.

http://strangemaps.files.wordpress.com/2006/11/800px-reagan-digitised-poster.JPG?w=474&h=362

hypsometric map


This hypsometric map shows elevation and relief by using shading.
Hypsometric colors are most common in topographic maps at small scales, either applied as continuous gradients or intervals


http://www.corinnelsen.com/dpc/maps/Elevation.jpg


PLSS Map


A PLSS Map is a Public Survey System map. It is a coordinate system which devides and subdevides the land use in the US. The Bureau of Land Management is responsible for regulating and maintaining the system.

Cadastral Map


A cadastral map is a map that shows how parcels of land boundaries are devided up, or measured out. It reveals the layout of property ownership. This is an example of a cadastral map.


http://www.cadastraltemplate.org/countrydata/cn3.jpg


Historical Map


Historical maps are generaly political maps, but can be any map in which an area's past has been depicted. It is very usefull in comparing to an area's modern construct in order to clearely compare the two and the changes that have occured over time.

Thematic Maps

Thematic maps are used to provide specific information about particular locations, show general information about spacial patterns, and can be used to compare data of two or more maps.


http://www.visualizingeconomics.com/wp-content/uploads/census_2006income.gif

Star Plots

'The Star Plot is a map used as an analysis technique. It plots information such that it makes a visual in which behavior of all relative variables in a data set can be examined at once.


http://upload.wikimedia.org/wikipedia/commons/0/09/MER_Star_Plot.gif

Monday, February 8, 2010

Topographic Map

Topographic Map


A map that illustrates elevation. Shows relief using contour lines, and is usually considered a large scale map.

Planimetric Map


Planimetric Map
A map indicating only horizontal features

or positions. Elevation does not play a role

in a Planimetric map.

http://belcherzoning.com/BZC%20Archives/images/planimetricArea-lg.gif


Mental Map


Mental Map
A mental map is a map one is able to recollect from memory. For example, you recall directions, as an adult, in your childhood neighborhood to the lake you used to enjoy visiting.


http://www.loosetooth.com/viscom/gf/mental_map.gif

Thursday, January 14, 2010

Black and White Aerial Photo


This is a black and white aerial photo of Pottawatomie County. The aerial photo allows people to view the topography of an area and a broad perspective of the layout of the land.